Daily Report
The Daily Report that is received in email provides the Supervisor with a report of all the coached assemblies that happened in the previous day. The email will come with 2 attachments, a CSV with all the data that can be imported into any tool that supports CSV files that you like, and a PDF report.
The main header of the PDF report likes like this:
A detailed explanation of each field in the main header is below:
Station ID:
The name the system running the Rapta SuperCoach
Date Range:
The dates of the oldest and newest coached assemblies in the Daily Report.
Time Generated:
The time the Daily Report was generated.
Pass Rate:
This is the average Pass Rate of all the Assemblies in this report.
Quality:
This is the average Quality of all the Assemblies in this report.
Confidence:
This is the average Confidence of all the Assemblies in this report.
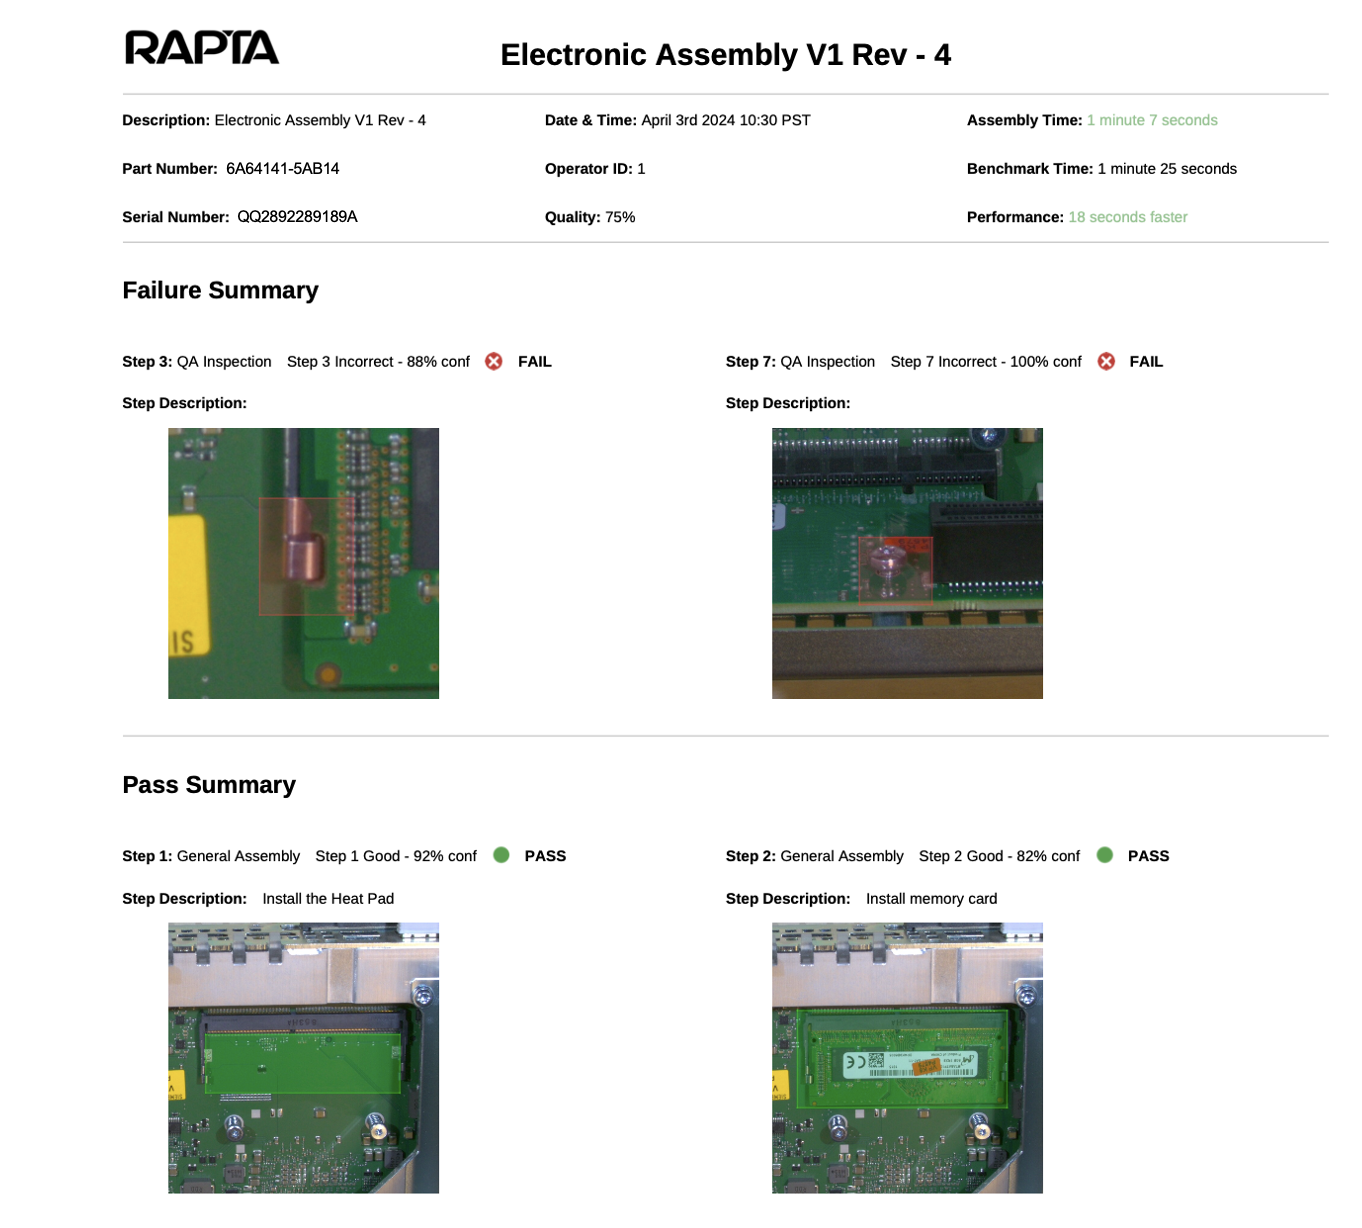
The sub headers in the Daily report summarize the results of a coached assembly. The sub headers look like this:
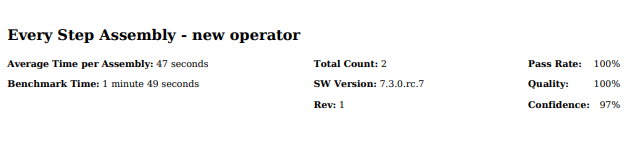
A detailed explanation of each field in the sub header is below:
Assembly Name – Operator:
This will be at the top of the sub header and will show the name of the assembly and the Operator name
Average Time per Assembly:
The amount of time it took, on average, for the operator to finish the assembly. This is takes all the adds all the assembly times together and divides by the number of times the assembly was coached.
Benchmark Time:
The amount of time it should take time complete the assembly. This time is determined by combining the length of each step. OCR-based steps are currently given a 10 second Benchmark Time.
Total Count:
This is the number of times this assembly has been coached.
SW Version:
The software version that was used to train this assembly revision
Rev.:
This is the revision of the assembly.
Pass Rate:
This is the total number of assembly steps minus the number of skipped assembly steps, divided by the total number of assembly steps, times 100
((total steps – skipped steps) / total steps) x 100
Quality:
This is the number of unskipped steps the number of steps that failed, divided by the number of unskipped steps, times 100
((unskipped steps – fails steps) / unskipped steps) x 100
Confidence:
This is the sum of all the step confidences of an assembly divided by the total number of steps (the mathematical mean)